How do Covid cases in Iceland compare to Britain?
Data
Looking at the seven-day rolling rate of new cases per 100,000 population in Iceland and the United Kingdom
I post here so infrequently that, despite being almost two years into this glorious global pandemic of ours, I don’t think I’ve mentioned Covid-19 before. And yet, even after all this time, it’s still something I think about everyday.
Living in Iceland and being of British extraction, I often compare my adopted home with the old country. When the populations are so different — 370,000 versus 67 million — it can be hard to compare the two. Iceland today had its highest number of daily cases (167), while just last month the UK was announcing over 50,000 cases a day. How do you compare numbers of such different magnitudes?
The solution that seems to have been settled in is to produce a rolling seven-day average per 100,000 population. That means that to calculate each day’s case count you:
- Sum the total number of cases over the previous seven days
- Divide that by seven to get the week’s average
- Divide that number by the total population
- Multiply that by 100,000 to get the rate per 100,000 people
A little fiddly, but fortunately we have computers to do these things for us. I knocked up a short R script to do the hard work for me, relying on the excellent Covid-19 data produced by Our World in Data as the source1. Add my favourite plotting library, ggplot2, into the mix and — hey presto, we have ourselves a chart.
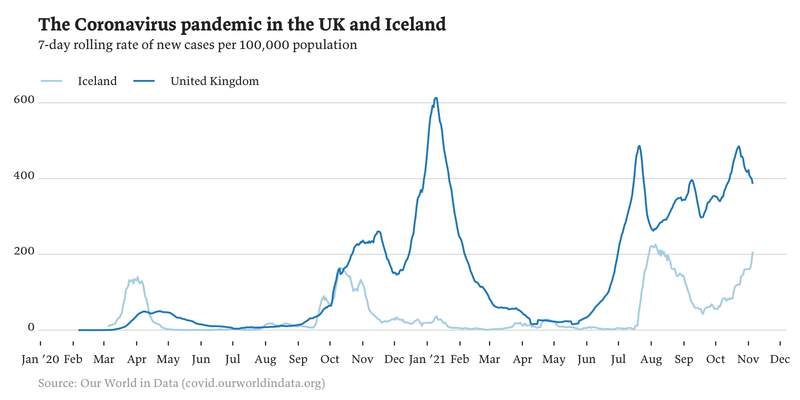
My first thought was that I’m glad I’m spending the pandemic in Iceland and not the UK. They are not doing a good job.
Then the details come in to focus. Why, when Iceland was struggling with the first wave in March 2020, was the UK not affected? Ahhhhhh, of course: because the UK wasn’t testing anyone. That gentle British hill is hiding an unknown number of cases. There’s also that huge jump in cases in the UK in January 2021, because the British government lifted restrictions in December so it couldn’t be accused of ‘cancelling Christmas’. And yet another bump, this time in Iceland, in July 2021, after most domestic restrictions were lifted. More like a cliff face than a bump, actually.
The story isn’t done of course. In Iceland, while 89% of the population over 12 is fully vaccinated that still leaves an awful lot of kids unprotected. But let’s hope both those lines start heading down and we can forget this pandemic thing ever happened.
I did make one change to the source data: it has Iceland’s population at 343,360 but the official figures have it at 368,792. The source figure is out by 7.4% and would skew the numbers substantially. I altered the source data to use the official population figure instead.