Are Leicester City in a relegation battle?
Visualisations
Will City end the 2022/23 season in the bottom three of the Premier League? Let’s see how City’s points so far this season compare to previous seasons’ relegated teams
The Covid-19 pandemic had many strange effects on people. For me, one result was that I lost interest in most TV, with the exception of live sporting events. For the first time in more than a decade, I started watching club football again. Although I haven’t lived in England for almost twenty years, I was born in Leicester and so I have an obvious choice for a team to follow: Leicester City. (Here in Iceland it seems that everyone supports Liverpool. Not sure why — possibly something to do with the fishing industry?) To my surprise, I really got into following City. Watching live games, listening to the BBC Radio Leicester podcast, and taking out a subscription to the Athletic so I could read Rob Tanner’s reports.
Last season had some highs (beating Liverpool and Man United), and some lows (losing 6–3 to Man City, withering away in Europe), but so far this season has mostly been lows. No new signings in the summer and too many losses have left City in an unenviable position. Fourteenth, only three points off rock bottom, and a tough run of games in February. Now the worry is that Leicester’s time in the Premier League might be coming to an end. Are Leicester City in a relegation battle?
Rather than panic, I wanted to try and come up with a data-driven answer to the question. I wanted to look back at previous Premier League seasons and compare Leicester’s current points total to that of all other teams that have finished in 18th place or lower (and so relegated to the division below). So I collected points tallies over time for every Premier League season since it become a 20-team league in 1995/96, and then focused on every team that finished 18th. (The three bottom teams, in 18th, 19th, and 20th are all relegated. Finish 17th or higher and you’re safe, for another year least.) Surely if Leicester can stay above the average points total for 18th position, they can survive and stay in England’s top flight?
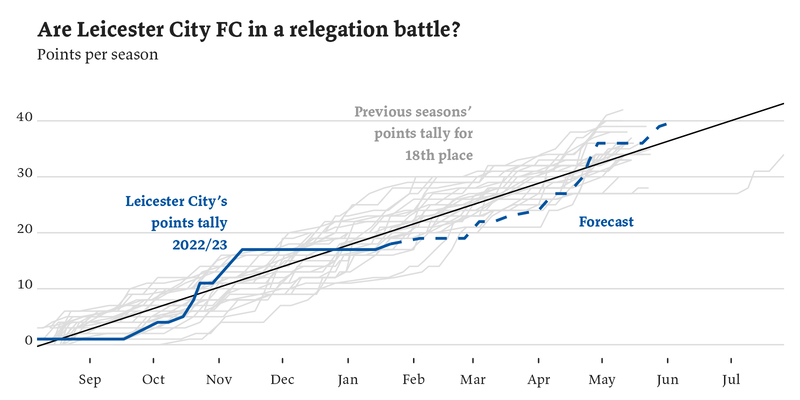
Leicester City have 18 points so far this season, and are forecast to finish on 40 points. The light grey lines show the points tallies for the teams that finished 18th in every season since 1995/96. Leicester are forecasted to do well in comparison, meaning they’re likely to stay up. The black line shows the average points for 18th place.
As you can see in the chart above, there’s some good news and some bad news. The bad news is that, right now, Leicester City have fewer points than teams that finish 18th have, on average, at this point in the season. Worse, if my forecast is correct (not a certainty), Leicester will stay on a below-average points total until late-April. But then the good news: a run of good results against Wolves, Leeds, and Everton will push City over the average, to finish on 40 points. In 27 seasons, only three teams have got 40 points and been relegated1. If my forecast is a good one, Leicester should be safe. My guess would be that City will finish in 16th or 17th position.
One thing that might change everything is Leicester’s good work in the January transfer window. It’s long been recognised the club needed an injection of new players, and in January City got three: two defenders and a Brazilian winger. If they settle well into the first team then they could improve results dramatically. A man can dream.
For the record, here are my predictions for Leicester’s remaining games this season. All the games I’ve predicted as wins are essentially ‘must-win’ games. It’s going to be tight.
| Date | Opposition | Location | Forecast | Result |
|---|---|---|---|---|
| 4 Feb | Aston Villa | Away | Draw | 2–4 win |
| 11 Feb | Spurs | Home | Lose | 4–1 win |
| 19 Feb | Man Utd | Away | Lose | 3–0 loss |
| 25 Feb | Arsenal | Home | Lose | 0–1 loss |
| 4 Mar | Southampton | Away | Win | 1–0 loss |
| 11 Mar | Chelsea | Home | Lose | 1–3 loss |
| 18 Mar | Brentford | Away | Draw | 1–1 |
| 1 Apr | Crystal Palace | Away | Draw | 2–1 loss |
| 4 Apr | Aston Villa | Home | Draw | 1–2 loss |
| 8 Apr | Bournemouth | Home | Win | 0–1 loss |
| 15 Apr | Man City | Away | Lose | 3–1 loss |
| 22 Apr | Wolves | Home | Win | 2–1 win |
| 25 Apr | Leeds | Away | Win | 1–1 |
| 1 May | Everton | Home | Win | 2–2 |
| 8 May | Fulham | Away | Lose | 5–3 loss |
| 13 May | Liverpool | Home | Lose | 0–3 loss |
| 20 May | Newcastle | Away | Lose | 0–0 |
| 28 May | West Ham | Home | Win | 2–1 win |
If you’ve got this far, you may be wondering how I made the chart. Well:
- Historical match scores were collected by using my command-line utility, HTMLTab, to download the tables from 11v11.com (such as this table of results from 1995/96, for example)
- The HTML tables were converted into CSV data files using a Python script
- The CSV match data was manipulated in R using dplyr to calculate seasonal points over time for every Premier League team
- I then pulled out all teams that finished 18th, and plotted them against Leicester’s results using ggplot2. I used a custom ggplot2 theme, ggflother, to style the chart
If that seems convoluted to you, you’re right. Data jobs like this are usually messy. The hardest part is finding a good data source — after that you just tweak ones and zeroes until you have something interesting.
West Ham in 2002/03 (42 points), Bolton Wanderers in 1997/98 (40 points), and Sunderland in 1996/97 (40 points).